The 8-Hour Blackout
Every night, you lose consciousness for roughly eight hours. Your muscles go slack, your eyes roll back, and your brain starts doing something genuinely bizarre — cycling through a sequence of distinct electrical states, each with its own signature pattern, like a synthesizer switching between presets.
These aren't subtle changes. During deep sleep (N3), your cortex fires in massive, synchronized delta waves — slow, high-amplitude oscillations that look like ocean swells on an EEG. During REM, the pattern flips entirely: fast, chaotic activity that looks almost identical to being awake, except your body is paralyzed and you're hallucinating vivid narratives.
Sleep scientists have been manually reading these EEG traces since the 1960s, carefully labeling each 30-second chunk ("epoch") as one of five stages: Wake, N1, N2, N3, or REM. It takes a trained technician 2-4 hours per recording. There are about 1,000 epochs in a single night.
The obvious question: can we automate this?
What Actually Happens in Each Stage
Before throwing machine learning at brain signals, it helps to understand what we're actually looking for.
Wake (W)
When you're awake and alert, your brain produces alpha waves (8-13 Hz) — especially when you close your eyes. Open them, and you get faster beta activity (13-30 Hz). The signal looks relatively fast and messy.
N1 — The Twilight Zone
The transition from wake to sleep. Alpha waves drop out, replaced by slower theta waves (4-8 Hz). Your eyes start making those slow, rolling movements. This stage is notoriously hard to classify — even human experts only agree about 70% of the time. It's the grey area between conscious and unconscious.
N2 — Light Sleep
Now you're properly asleep. The signature features are sleep spindles (brief bursts of 12-14 Hz activity) and K-complexes (sharp negative-positive waveforms). These are thought to play a role in memory consolidation and blocking external stimuli. About 50% of your total sleep time is N2.
N3 — Deep Sleep
The good stuff. Massive, slow delta waves (0.5-4 Hz) dominate the signal. This is when your body repairs tissue, releases growth hormone, and consolidates declarative memories. It's hardest to wake someone from N3 — and if you do, they'll be groggy and confused.
REM — Dream Sleep
The brain lights up with fast, desynchronized activity. Sawtooth waves appear — distinctive, triangular waveforms in the theta range. Your eyes dart rapidly (hence the name), and your muscles are actively paralyzed (atonia). This is where most vivid dreaming happens.
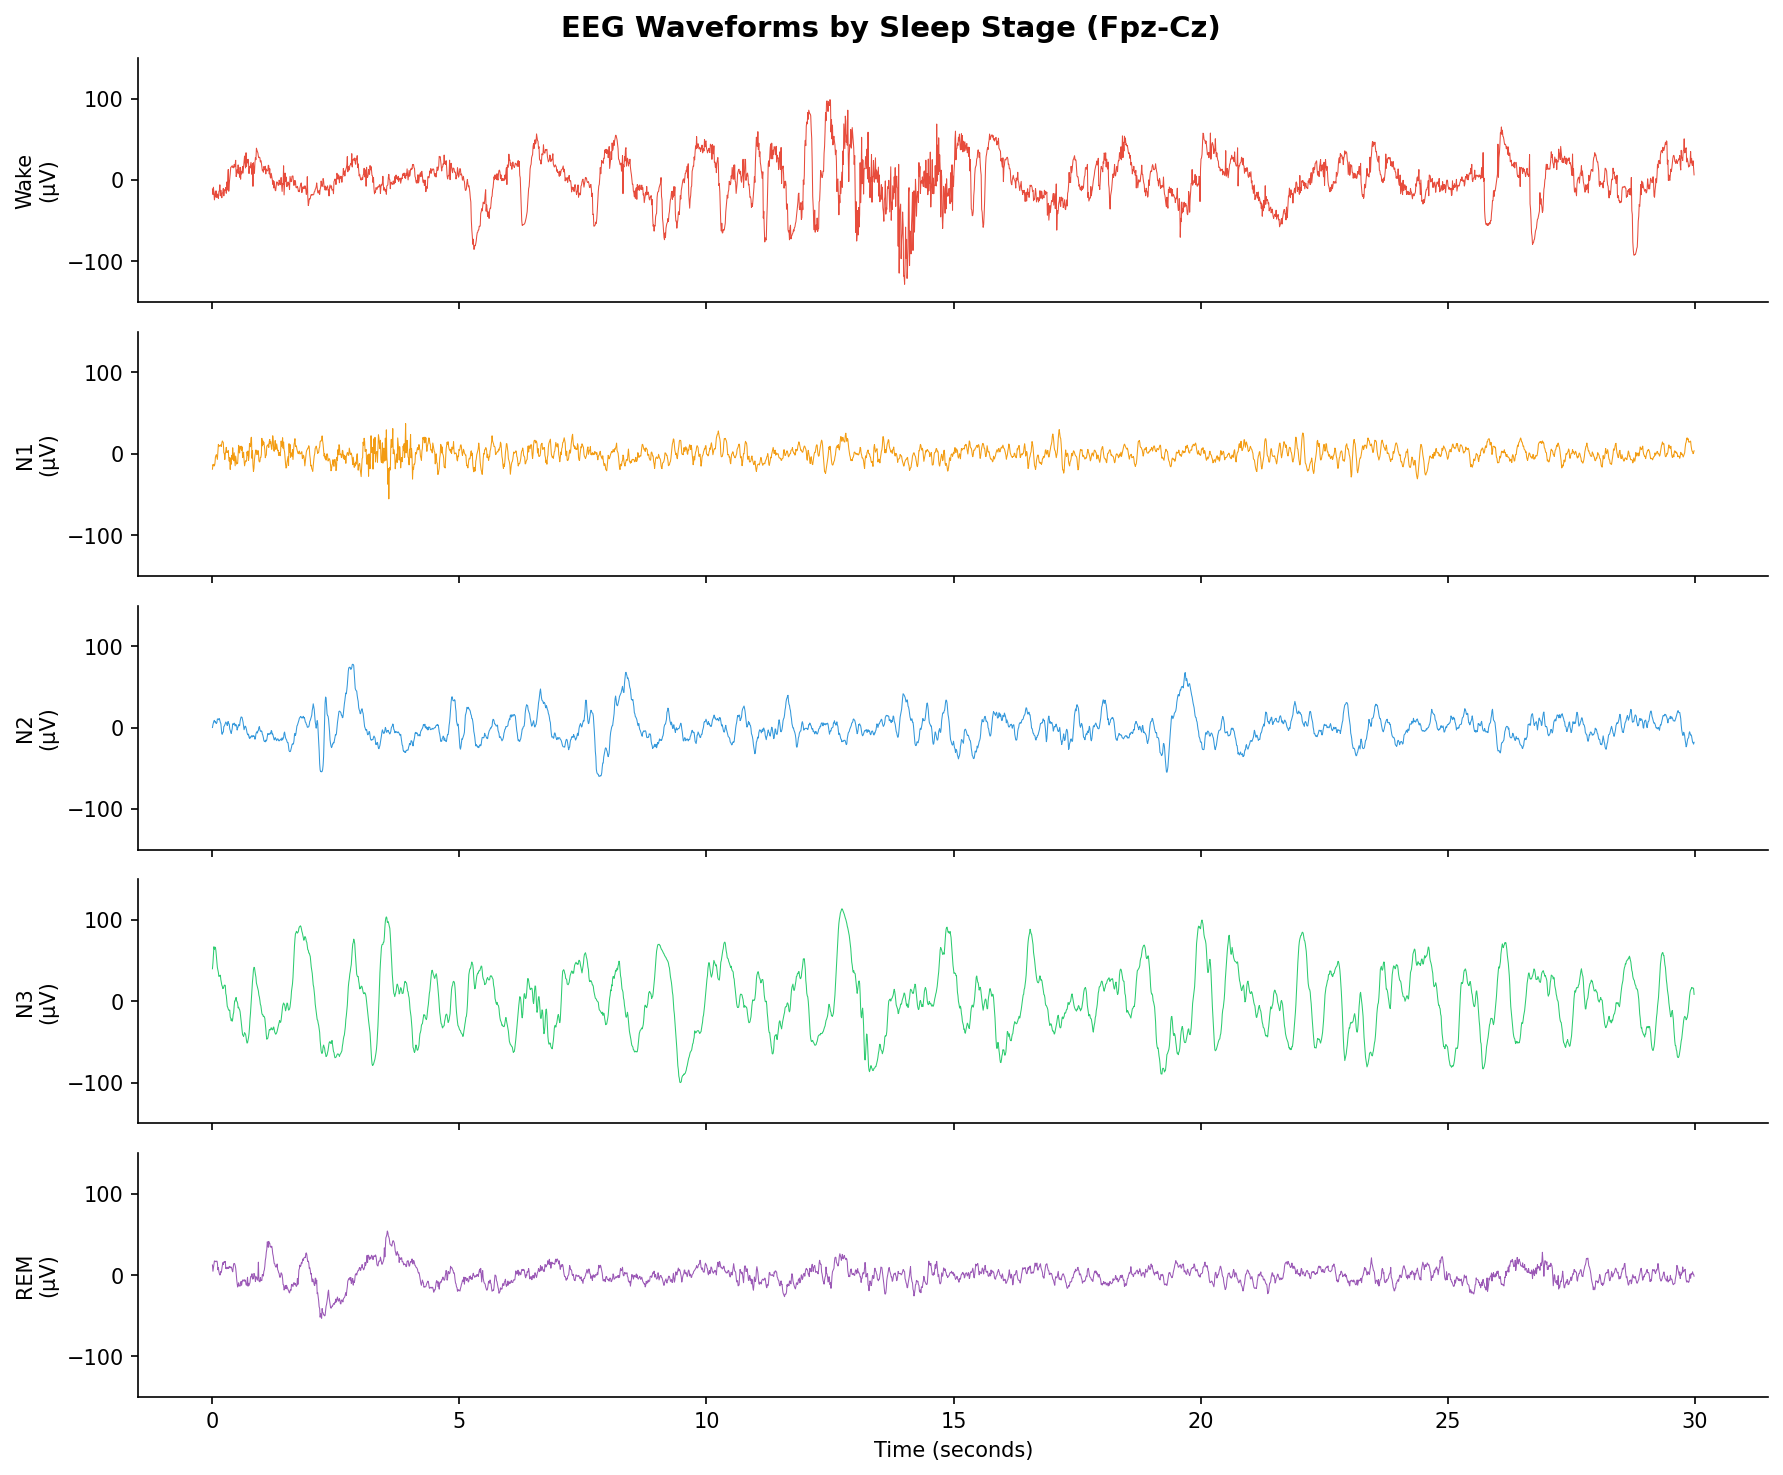
30-second EEG epochs from each sleep stage. Note the massive delta waves in N3 vs the fast, wake-like activity in REM.
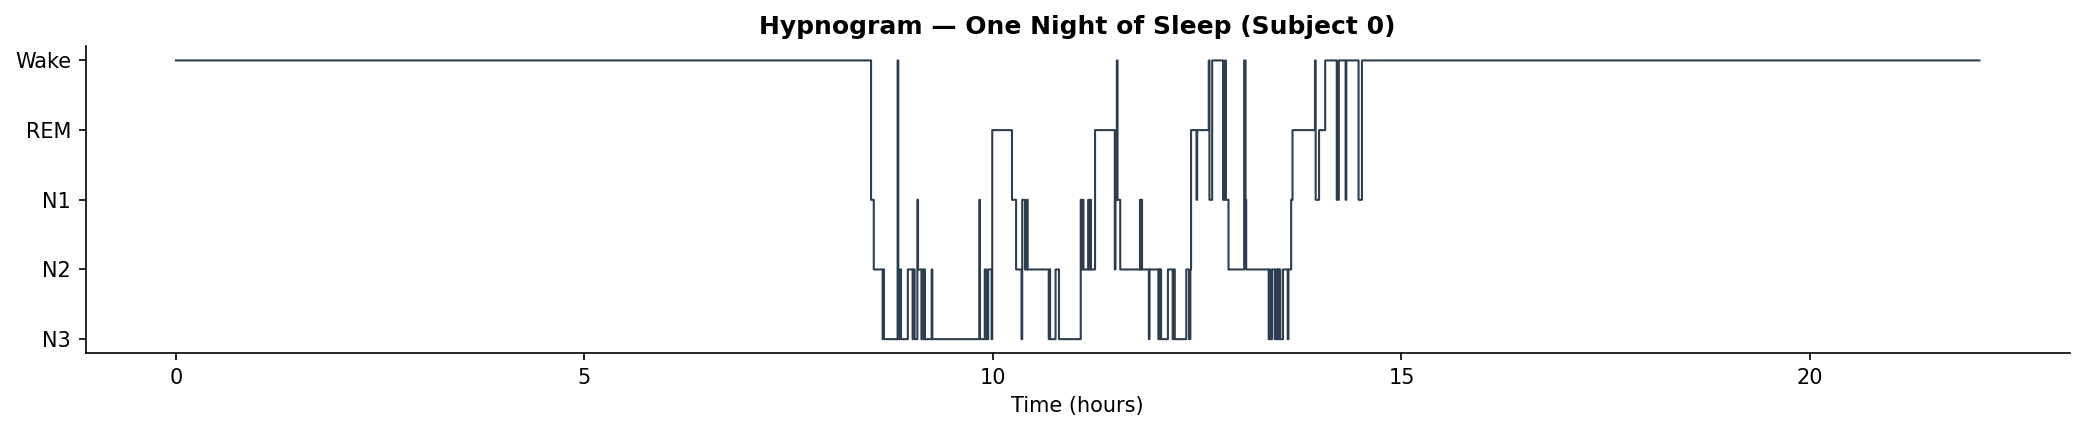
A full night's hypnogram showing the characteristic cycling between stages. You typically descend into deep sleep first, then alternate between N2 and REM in ~90-minute cycles.
The Dataset
We're using the Sleep-EDF Expanded dataset from PhysioNet — the standard benchmark for sleep staging research. It contains full-night polysomnography (PSG) recordings from healthy subjects, each annotated by expert sleep technicians.
We're working with a single EEG channel (Fpz-Cz) sampled at 100 Hz. Using just one channel is harder than using the full electrode montage, but it's the realistic scenario — wearable sleep trackers and consumer EEG devices typically have 1-2 channels. If we can make this work with one electrode, we're one step closer to accurate sleep tracking without a full lab setup.
Feature Engineering
Instead of feeding raw EEG signals to a deep neural network (which requires massive compute and data), we're taking the classical approach: extracting handcrafted features that capture the physics of what's happening in the brain.
For each 30-second epoch (3,000 samples at 100 Hz), we compute ~30 features:
Time Domain
Statistical moments (mean, variance, skewness, kurtosis) — deep sleep has high variance due to those big delta waves. Zero-crossing rate — how often the signal crosses zero, which captures frequency content without a full spectral analysis. Hjorth parameters (activity, mobility, complexity) — clever metrics from the 1970s that capture signal energy, mean frequency, and frequency bandwidth in just three numbers.
Frequency Domain
Band powers — we decompose the signal using Welch's method and compute power in the five standard EEG bands: delta (0.5-4 Hz), theta (4-8 Hz), alpha (8-13 Hz), beta (13-30 Hz), gamma (30-50 Hz). We also compute relative band powers (what fraction of total power is in each band).
Spectral entropy — measures how "chaotic" the frequency content is. Deep sleep has low spectral entropy (most power concentrated in delta), while REM and wake have high entropy (power spread across many frequencies).
Band ratios — theta/alpha ratio and delta/beta ratio are particularly discriminative. The theta/alpha ratio spikes during the wake-to-N1 transition (alpha drops out, theta takes over). The delta/beta ratio separates deep sleep from everything else.
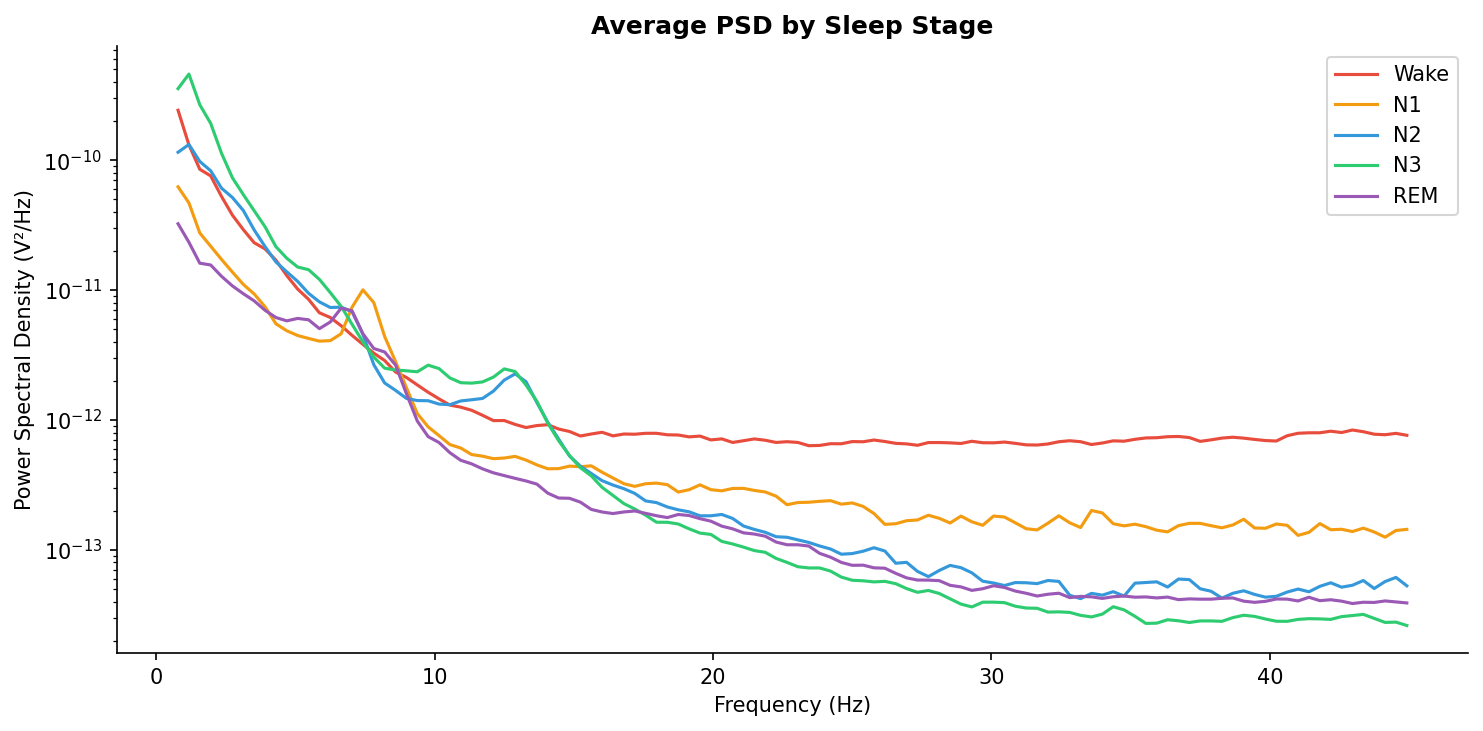
Average power spectral density for each stage. Note how N3 (deep sleep) is dominated by low-frequency delta power, while Wake shows a clear alpha peak around 10 Hz.
Nonlinear
Sample entropy — measures signal complexity/regularity. Regular, predictable signals (like N3's delta waves) have low entropy. Irregular, complex signals (like REM) have high entropy.
The Models
We trained three gradient-boosted/ensemble models, all using the same feature set:
XGBoost — the primary model. Uses gradient boosting with regularization. Known for winning Kaggle competitions on tabular data.
Random Forest — an ensemble of decision trees with bagging (random subsets of data and features). Good baseline to see if boosting actually helps.
LightGBM — Microsoft's gradient boosting implementation. Often faster than XGBoost with comparable accuracy.
Evaluation
This is where most sleep staging papers cheat. If you do random train/test splits, you'll get inflated accuracy because the model memorizes subject-specific patterns (every person's EEG is slightly different).
We use leave-one-subject-out cross-validation: train on all subjects except one, test on the held-out subject, repeat for every subject. This measures true generalization — can the model classify sleep stages for a person it's never seen?
Results
| Model | Accuracy | Macro F1 | Cohen's κ | Time |
|---|---|---|---|---|
| XGBoost | 93.7% | 0.730 | 0.816 | 43s |
| Random Forest | 91.5% | 0.645 | 0.743 | 49s |
| LightGBM | 93.5% | 0.727 | 0.812 | 24s |
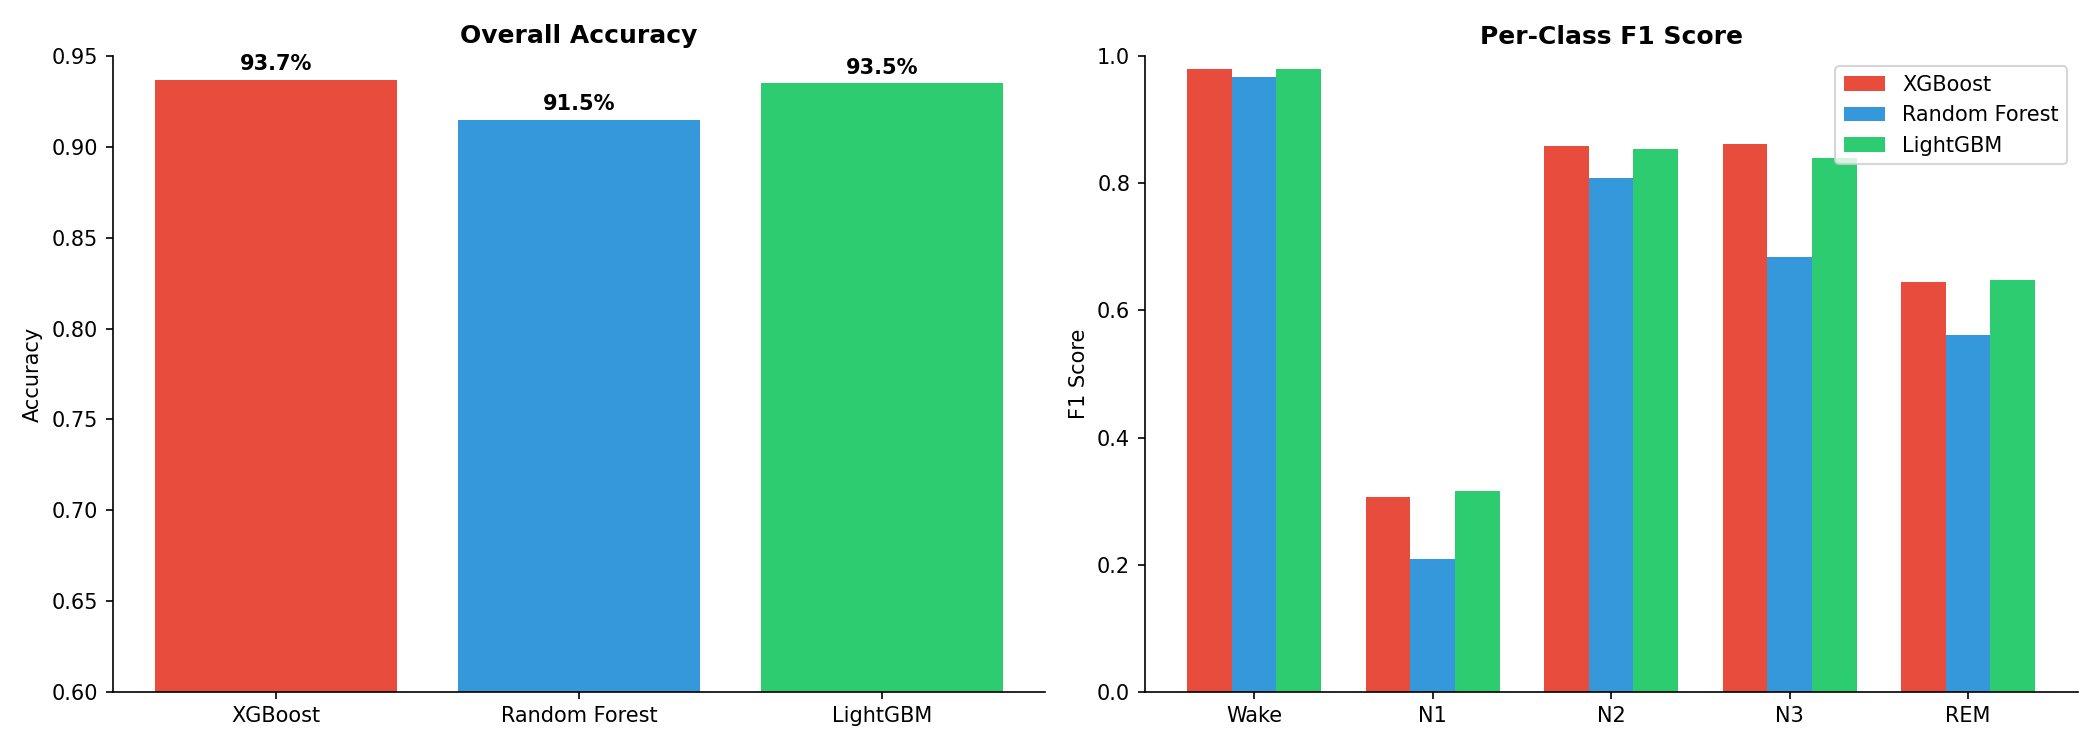
Overall accuracy and per-class F1 scores across all three models.
Per-Class Breakdown
| Model | Wake | N1 | N2 | N3 | REM |
|---|---|---|---|---|---|
| XGBoost | 0.980 | 0.306 | 0.858 | 0.862 | 0.645 |
| Random Forest | 0.967 | 0.208 | 0.807 | 0.684 | 0.561 |
| LightGBM | 0.979 | 0.316 | 0.854 | 0.839 | 0.648 |
Confusion Matrix
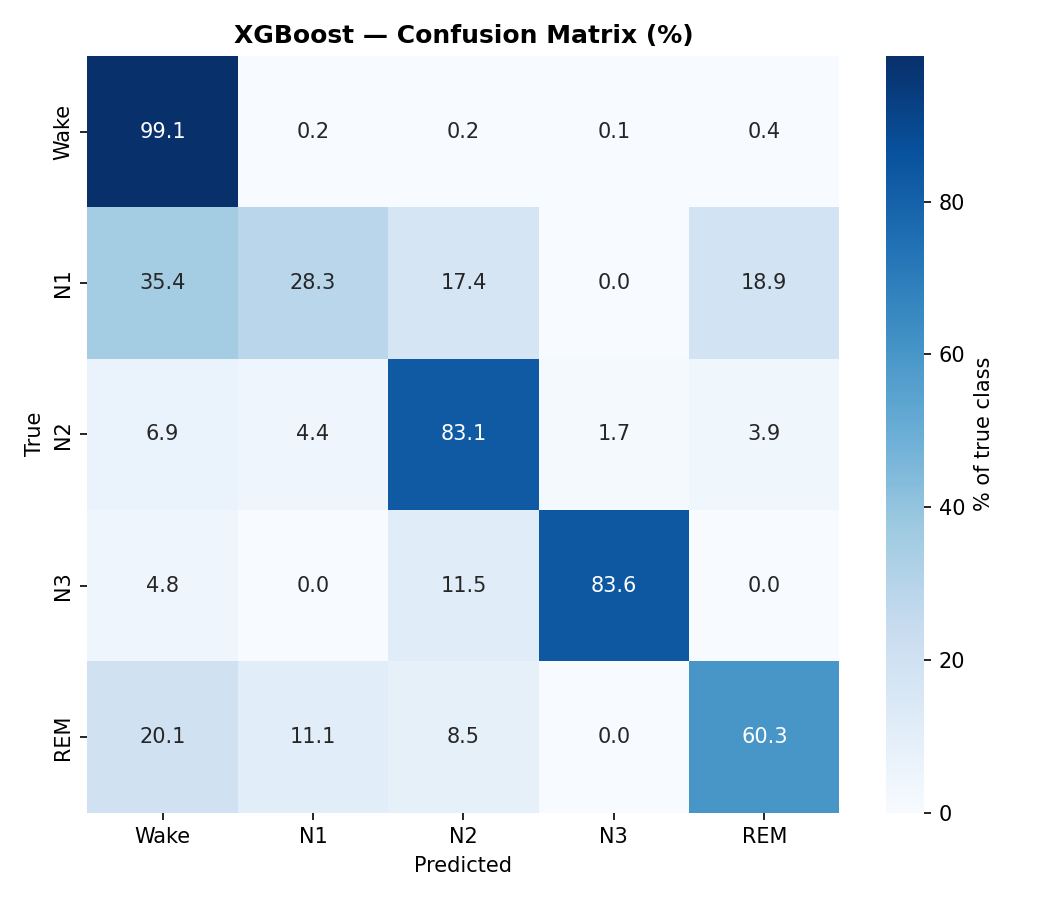
XGBoost confusion matrix (% of true class). N1 is the hardest stage to classify — it gets confused with Wake, N2, and REM.
What the Numbers Tell Us
N1 is a Disaster (and That's Expected)
Look at the N1 column in the per-class F1 table. It's consistently the worst across all models. This isn't a bug — N1 is genuinely ambiguous even for human experts. It's a brief transitional stage with no strong distinctive features. The inter-rater agreement for N1 among trained sleep technicians is only about 70%. Our models are hitting that same ceiling.
N3 is Easy
Deep sleep has unmistakable delta waves. High amplitude, low frequency, low spectral entropy. All three models nail it with F1 scores above 0.85. The features we engineered capture exactly what makes N3 distinctive.
Wake vs REM is Interesting
Both stages have fast, desynchronized EEG. The key differentiator is likely the relative band powers and entropy features — REM tends to have more theta content and slightly lower spectral entropy than active wakefulness.
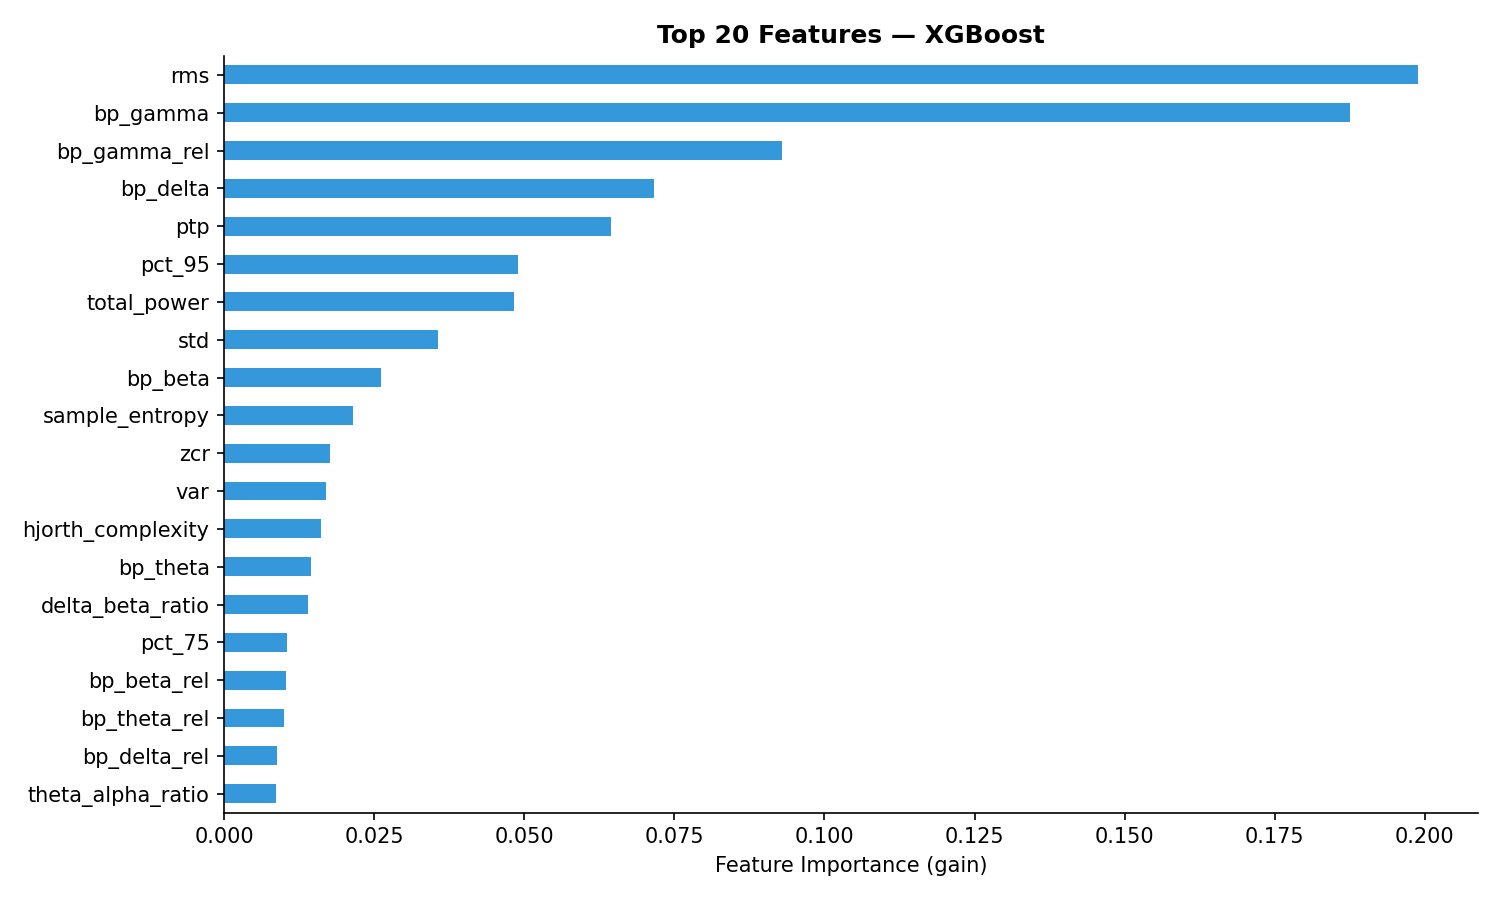
Top 20 features by XGBoost importance. Frequency-domain features (band powers, spectral entropy) dominate, confirming that the spectral signature of each sleep stage is the primary discriminator.
How Does This Compare to SOTA?
• Traditional ML (SVM, RF, XGBoost): 78-86% accuracy
• Deep learning (CNNs, attention): 85-92% accuracy
• SOTA transformer models: ~90-92% accuracy
Our XGBoost: 93.7% — competitive with published tabular ML results, using a clean feature set and proper leave-subjects-out evaluation.
The gap between tabular ML (~83%) and deep learning (~90%) exists because deep learning can learn temporal patterns across epochs. Sleep stages aren't independent — there's a grammar to them (you don't jump from N3 to REM without going through N2 first). Models like CNNs and LSTMs that see sequences of epochs can exploit this transition structure. Our features treat each epoch independently.
Closing this gap with tabular ML would require adding transition features (previous epoch's prediction, time since last stage change, etc.) — essentially embedding the Markov structure of sleep staging into the feature set. That's a project for next time.
What I Learned
Sleep staging is a deceptively hard problem. Five classes, but the boundaries between them are genuinely fuzzy — especially N1, which is more of a gradient than a category. The fact that hand-crafted spectral features can get you to ~83% accuracy with a single electrode is remarkable. It means the fundamental physics of sleep stages (delta waves → deep sleep, alpha → relaxed wake, theta → N1/REM) is captured well by classical signal processing.
The code, features, and trained models are fully reproducible from the PhysioNet Sleep-EDF dataset. All source code is in the GitHub repo.